

THE INLAND EMPIRE: BY THE NUMBERS
Our Region
We’re Young and Diverse
- 4.5 million: Population of Riverside and San Bernardino Counties.
- 120+: Number of people moving into the IE every day.
- 7 million: Projected population of the IE within 30 years.
- 1 in 9: Proportion of California residents who live in the Inland Empire.
- 27,000: Number of square miles comprising the IE – larger than 10 states. San Bernardino County is the largest geographic county in the U.S.
- 52: Number of cities in the two- county region.
- 56: Number of School Districts in the two-county region.
- 832,000: Number of K-12 students attending school in the two-county region.
- 32: Median age in San Bernardino and Riverside Counties – five years younger than the California average and six years younger than the U.S. average.
- 26%: Percentage of the population in San Bernardino and Riverside Counties under the age of 18. The state and national averages are less than 23%.
- 68%: Percentage of IE residents who are people of color.
- 51%: Percentage of IE residents who are Latinx.
- 41%: Percentage of IE households in which a language other than English is spoken at home.
- 20%: Percentage of adults in the IE who have a four-year college degree or higher (versus 32% for California and 30% for the nation as a whole).
Real Cost Measure
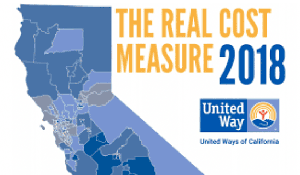 In its report Struggling to Move Up: The Real Cost Measure in California 2021, United Way of California compiled a detailed analysis of the amount of income required for households to meet their basic needs. The analysis showed that Inland Empire families have made some progress but continue to struggle to meet basic costs of living. People of color are particularly challenged, although they fare better in the IE than in the state as a whole.
34%: Percentage of all IE households who fall below the Real Cost Measure (lack income to meet their basic needs). This is 1 percentage point higher than the California average, an improvement from 3 points higher in the 2018 report.
45% / 37% / 34%: Proportions of Latino, Native American, and African-American households who are struggling. This compares favorably to the statewide average for those groups (52%, 39%, and 41% respectively) but trails AAPI and White households in the IE, of whom 29% and 23% struggle to meet basic needs.
383,098: Number of households in the IE that fall below the Real Cost Measure — 97% of which have at least one adult who is employed.
$76,972: Income needed to sustain a family of four (2 adults, 1 infant, 1 school-age child) in the Inland Empire. Such a family would need more than 3 full-time minimum-wage jobs to achieve economic security.
$26,788: Income gap for the average household living below the Real Cost Measure to meet their family’s basic needs.
Source for Data
United Way of California: https://www.unitedwaysca.org/realcost
Our Nonprofits
- 11,000: Number of nonprofit organizations in the Inland Empire.
- $115 million: Annual contributions from philanthropic foundations to IE nonprofits as of 2016 – an increase of 85% from 2013 ($61.3 million).
- $98 million: Annual foundation investment coming in from outside the region as of 2016 – more than double the 2013 total ($46 million).
- $25.55: Per capita foundation spending on nonprofits in the Inland Empire.
- $262.99: Per capita foundation spending on nonprofits throughout California.
- $2.5 million: Amount raised from individual donors in the IE during one-day annual web-athons (Give Big Riverside County, Give Big San Bernardino County) over a five-year period.
- 67%: of Inland Empire nonprofits with annual revenues below $25,000.
Sources for Data
U.S. Census Quick Facts: https://www.census.gov/quickfacts
California Department of Education Data & Statistics : https://www.cde.ca.gov/ds/
U.S. Conference of Mayors Research: https://www.usmayors.org/category/reports/
Southern California Association of Governments Research: https://scag.ca.gov/DataAndTools/Pages/Home.aspx
UC-Riverside Center for Economic Forecasting: https://ucreconomicforecast.org
UC-Riverside Center for Social Innovation: State of Immigrants: https://socialinnovation.ucr.edu/research/immigrants/
California Foundation Center: https://california.foundationcenter.org/
San Bernardino County Community Indicators Report: https://www.iegives.org/wp-content/uploads/2020/04/SB_2019-Report.ONLINE.pdf
United Ways of California: https://www.unitedwaysca.org/realcost